

Big numbers are interesting. But big numbers are also hard to grasp. In statistics, they usually get broken down by person, which of course is very informative. These per capita figures are especially valuable for policy makers. The downside is, that it creates an individualized perspective and as a citizen it is often hard to find yourself in these figures.
Big numbers broken down by time can reveal a different picture. It brings you closer to what happens at the moment. Of course, this also shows you just a part of the story. But my aim was not to dive deep into a topic, but to get people to think about the subject. In a fast-moving world, these infographics designed for social media should spark interest and hopefully lead to reflection.
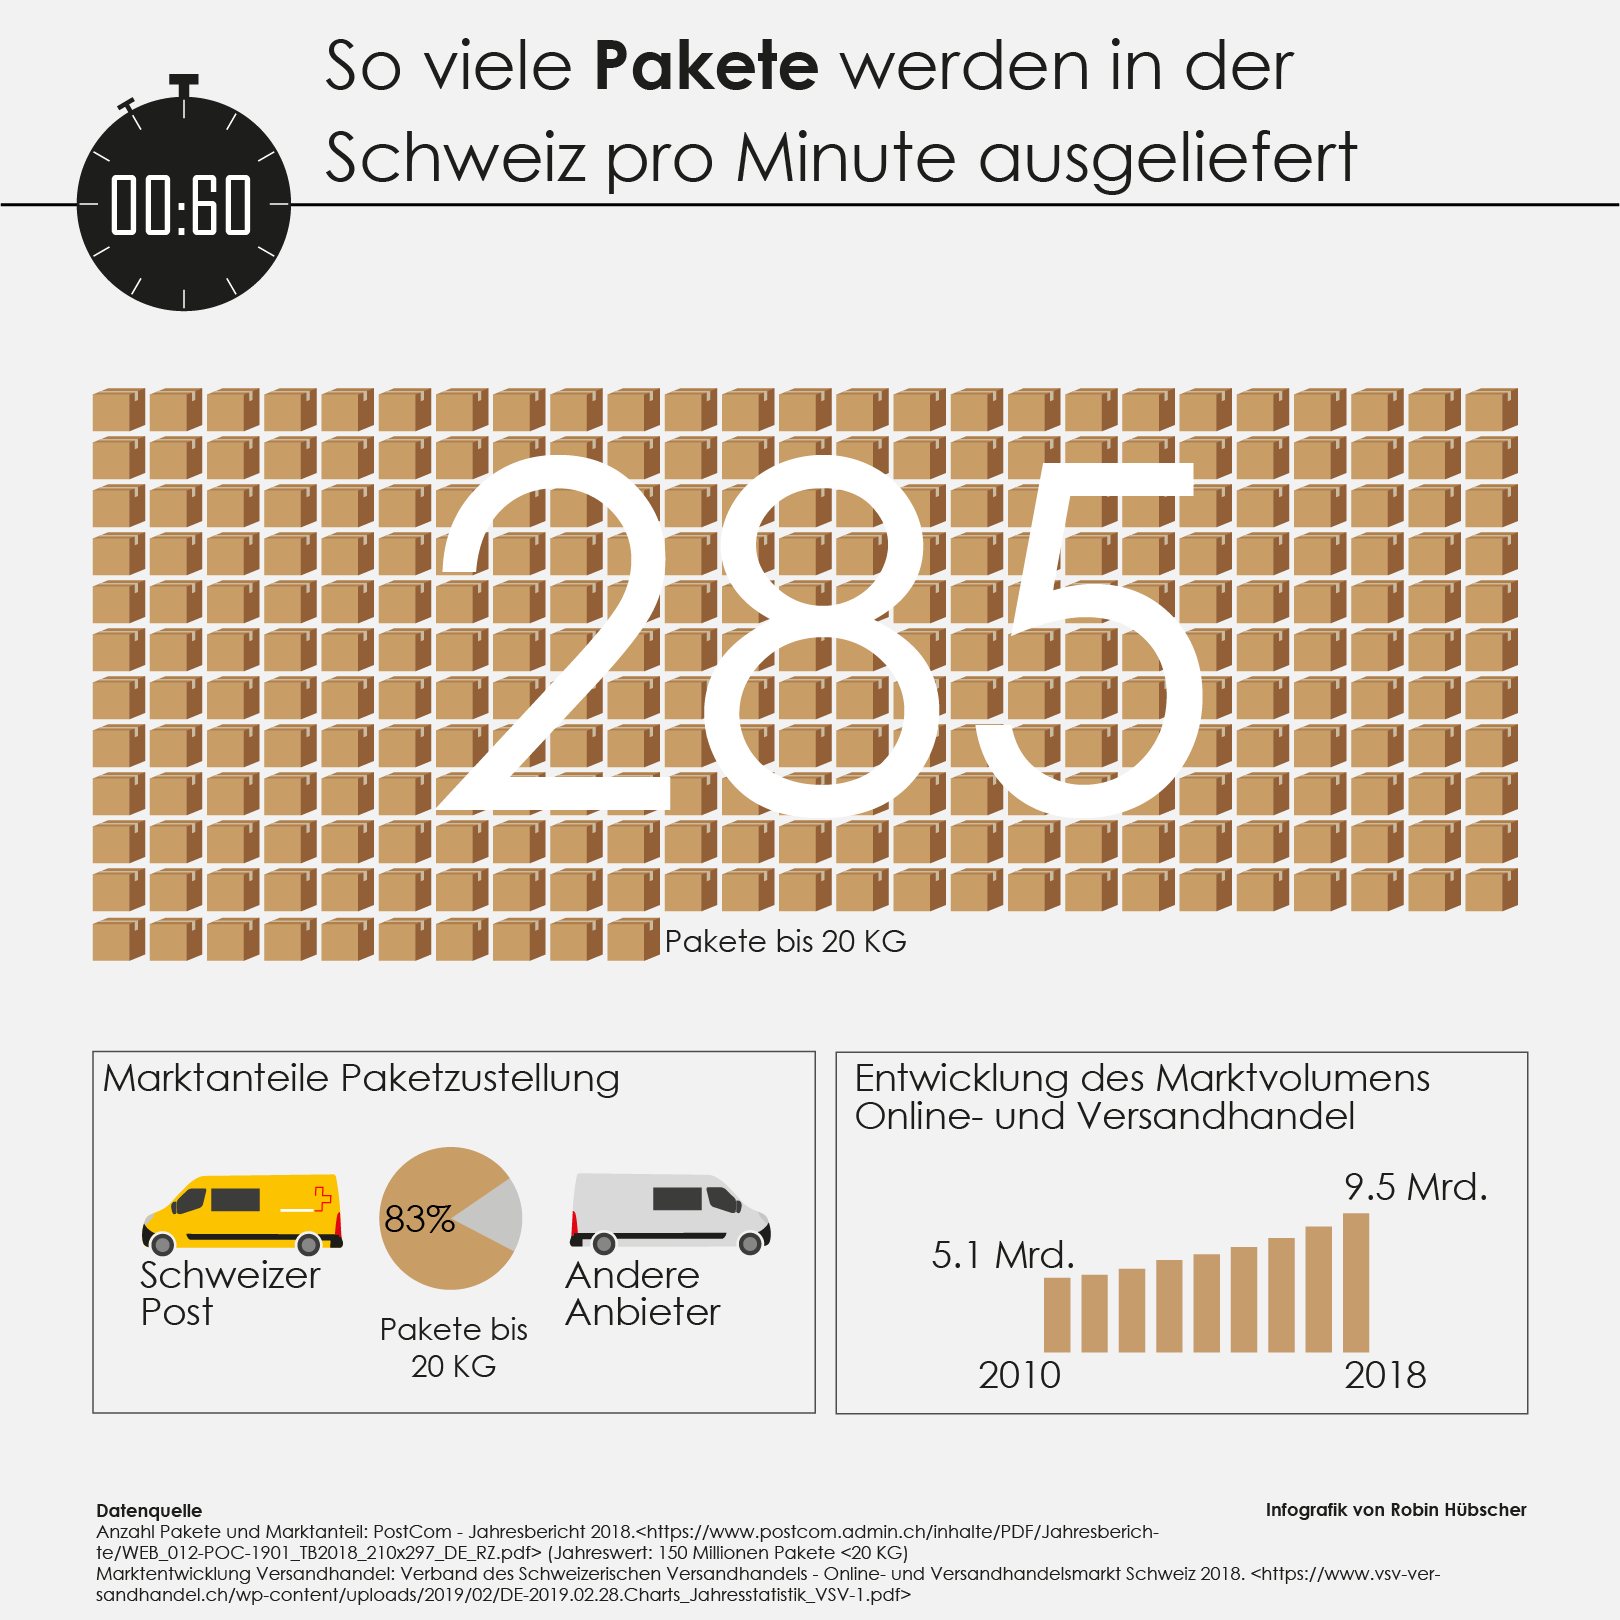
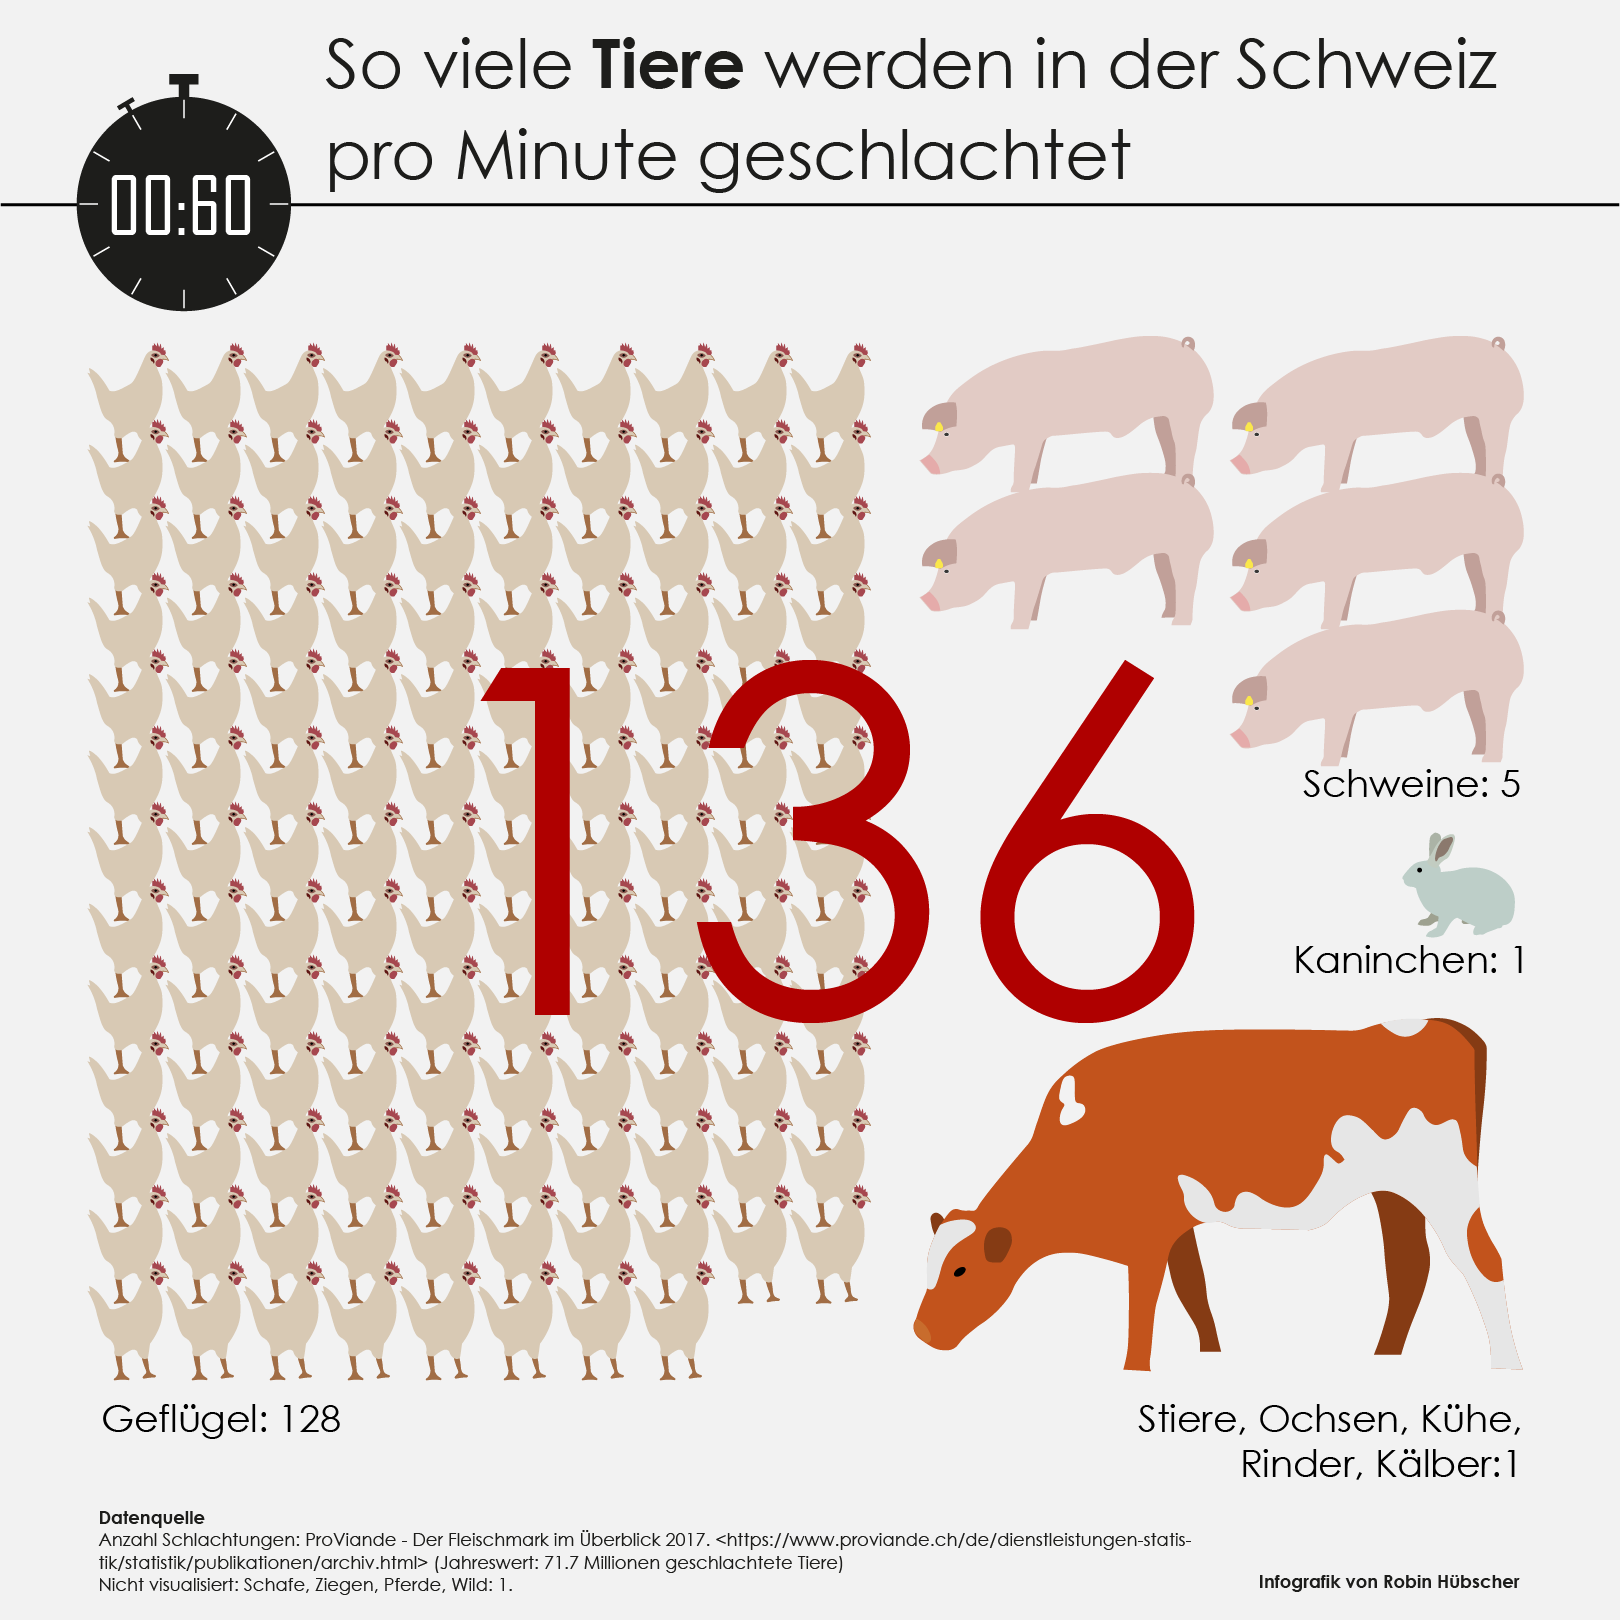
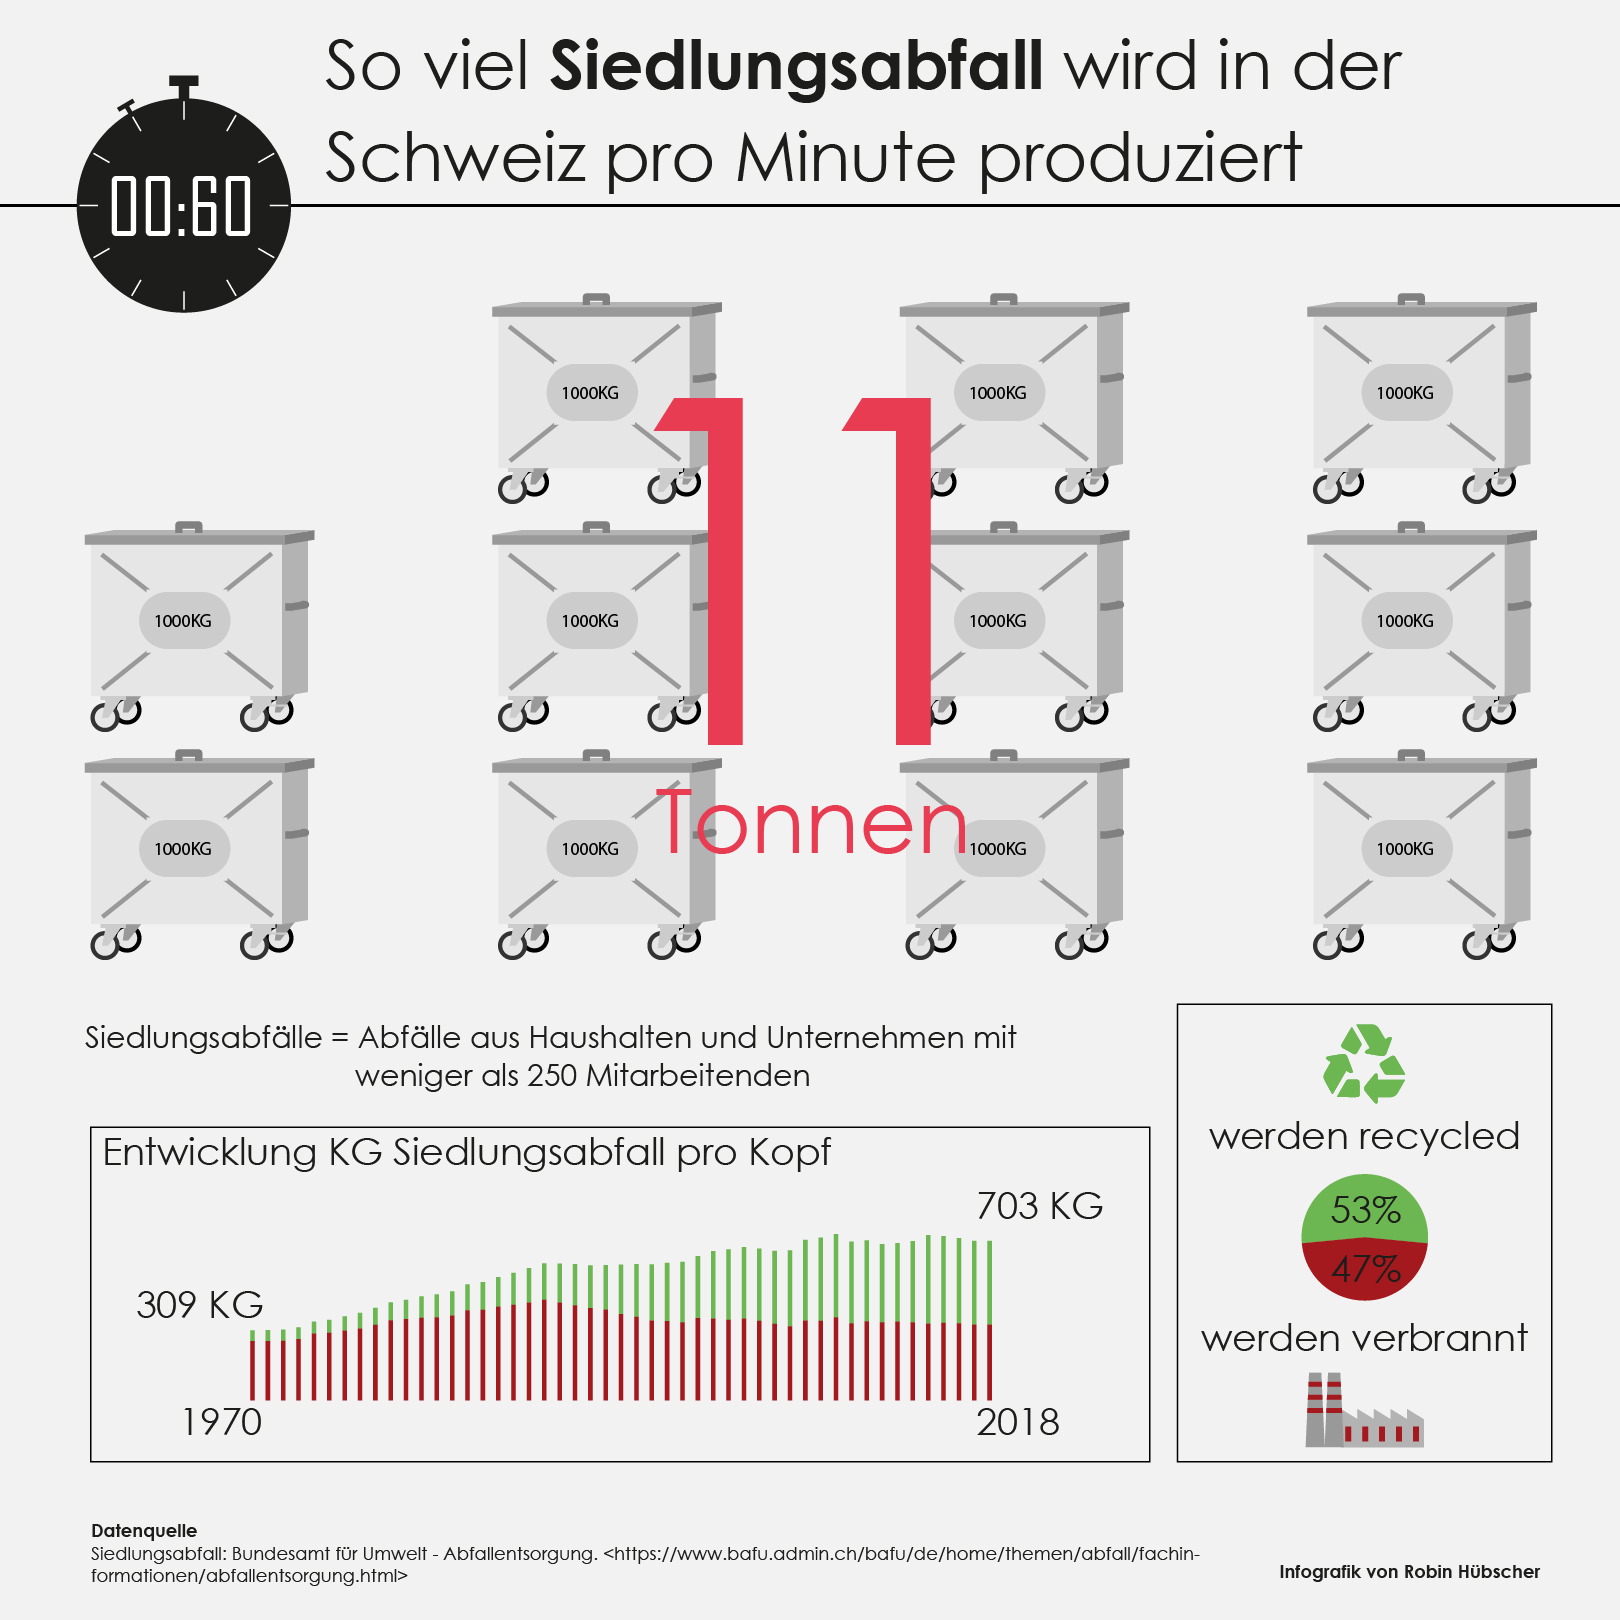


The topics are all related to consumption. The consequences of climate change are getting evident all over the world. We need to reflect on our way of life as well as how and what we consume. But we should not only ask what each person can do but what we as a society must do. And this is why looking at the numbers broken down by time are an interesting alternative to numbers broken down by person.
